Best Chart Software for Stocks Trading (2023)
Choosing the right charting software can be daunting, but it is also the most important in trading. The charts are where your eyes spend most time on, therefore you should choose the right one that will not only meet your needs in terms of what it can do but also how you will interact with what you look at. Let us take a look at different chart software and what they offer.

Tradingview
Tradingview is an excellent platform for beginners and intermediates that need an affordable and easy-to-use platform chart with a simple interface.

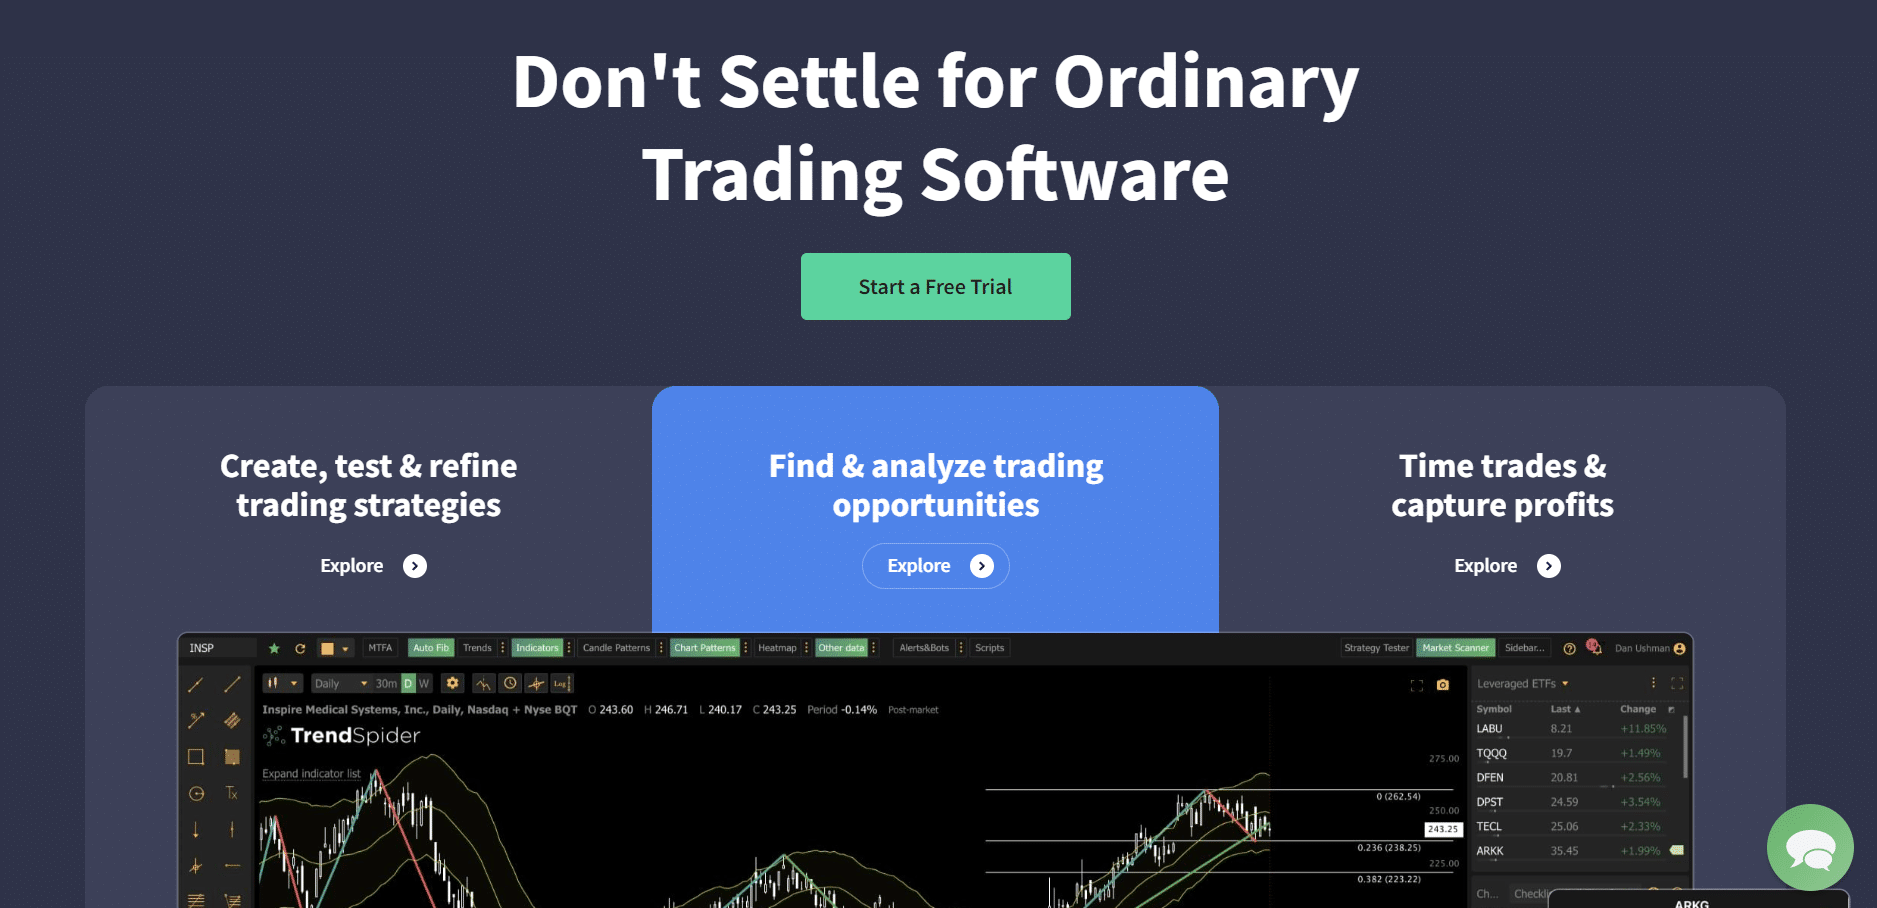
Trendspider
Trendspider is an innovative and easy-to-use charting software designed to help traders of stocks and options make more informed decisions.
Trade-Ideas
Discover the platform that gives you the freedom to use AI generated alerts that is integrated on the charts.Founded in 2003, it is recognized as a leader in the industry

TC2000
TC2000 combines charting, stock & option screening, and trading features in an easy-to-use, polished platform. It has been recognized as an industry leader for over 25 years.

Finviz
Finviz is a stock and market screener website that provides users with a variety of data and analysis tools to help them make informed decisions.
What Is A Chart Software Indicator
Stock charting software is a tool that helps to visualize stock market data, analyze trends, and spot emerging patterns.
Charting solutions assist traders with technical analysis, which attempts to make predictions about the market based on historical and real-time data.
The four types that are most common are—line chart, bar chart, point and figure chart and candlestick chart.
The choice is up to you.
Here are the top picks for the best stock charts this year.
1. Tradingview
Best Technical Stock Charts For Beginners And Intermediate

Our Take
Trading View Chart Software is a powerful and comprehensive charting platform used by traders all over the world. It allows users to view real-time and historical market data, create custom charts, design trading strategies, and more.
| Best For | Highly Customizable |
|---|---|
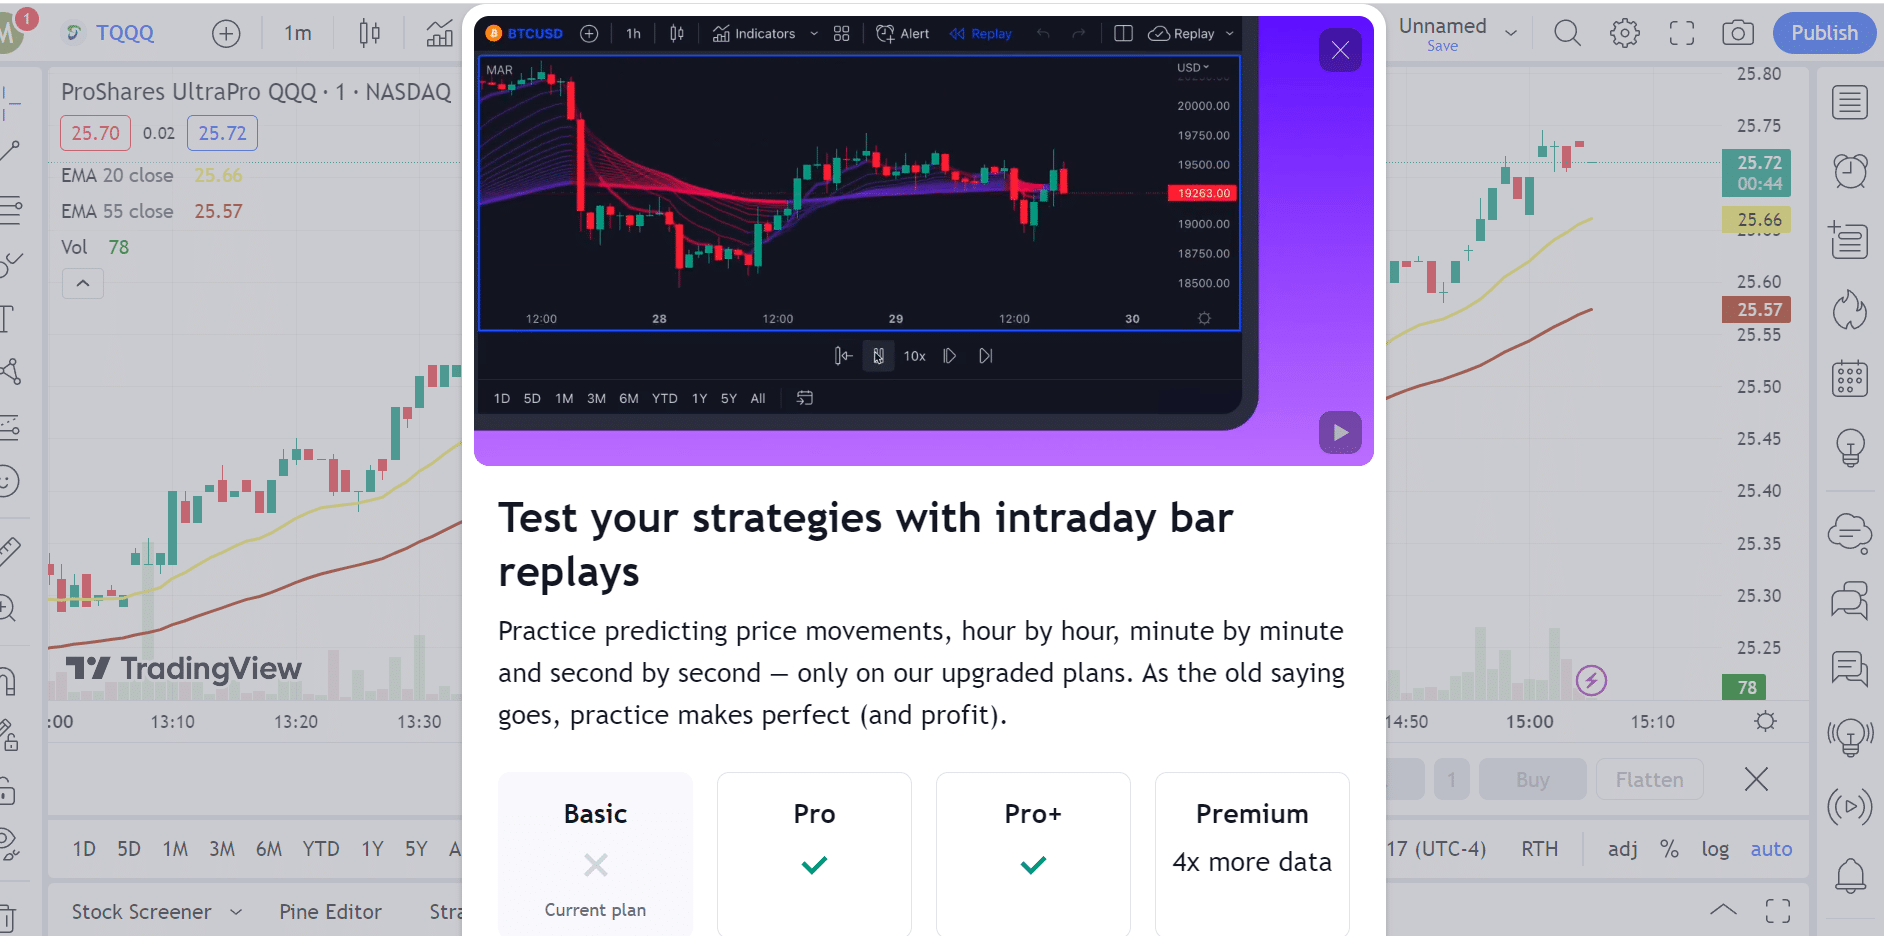
| Price | $12.95/mo to $49.95/mo |
| Annual Discount | yes |
| Promotion | Save 20% |
Trading View Chart Software allows traders to view real-time market data in a highly customizable format..
his makes it easy to keep track of the latest market movements and make informed decisions.
The software includes an array of advanced technical indicators and charting tools, making it easy to analyze market trends and identify trading opportunities.
Trading View Chart Software also allows traders to create automated trading strategies and backtest them against historical data. This makes it easier to optimize trading strategies and reduce trading risks.
Trading View Chart Software has an intuitive and user-friendly interface, making it easy to navigate and use.
The software also includes helpful tutorials and support resources to help users get up to speed quickly.
With their assistance, you’ll be able to quickly learn any technical issues and create a successful online trading.
50 Million plus and investors use Tradingview Platform.
Key Features:
- 12 chart types. Including Renko, Kagi and Point & Figure — all customizable.
- Up to 8 charts per tab. Plus, synchronize symbols, intervals and even drawings.
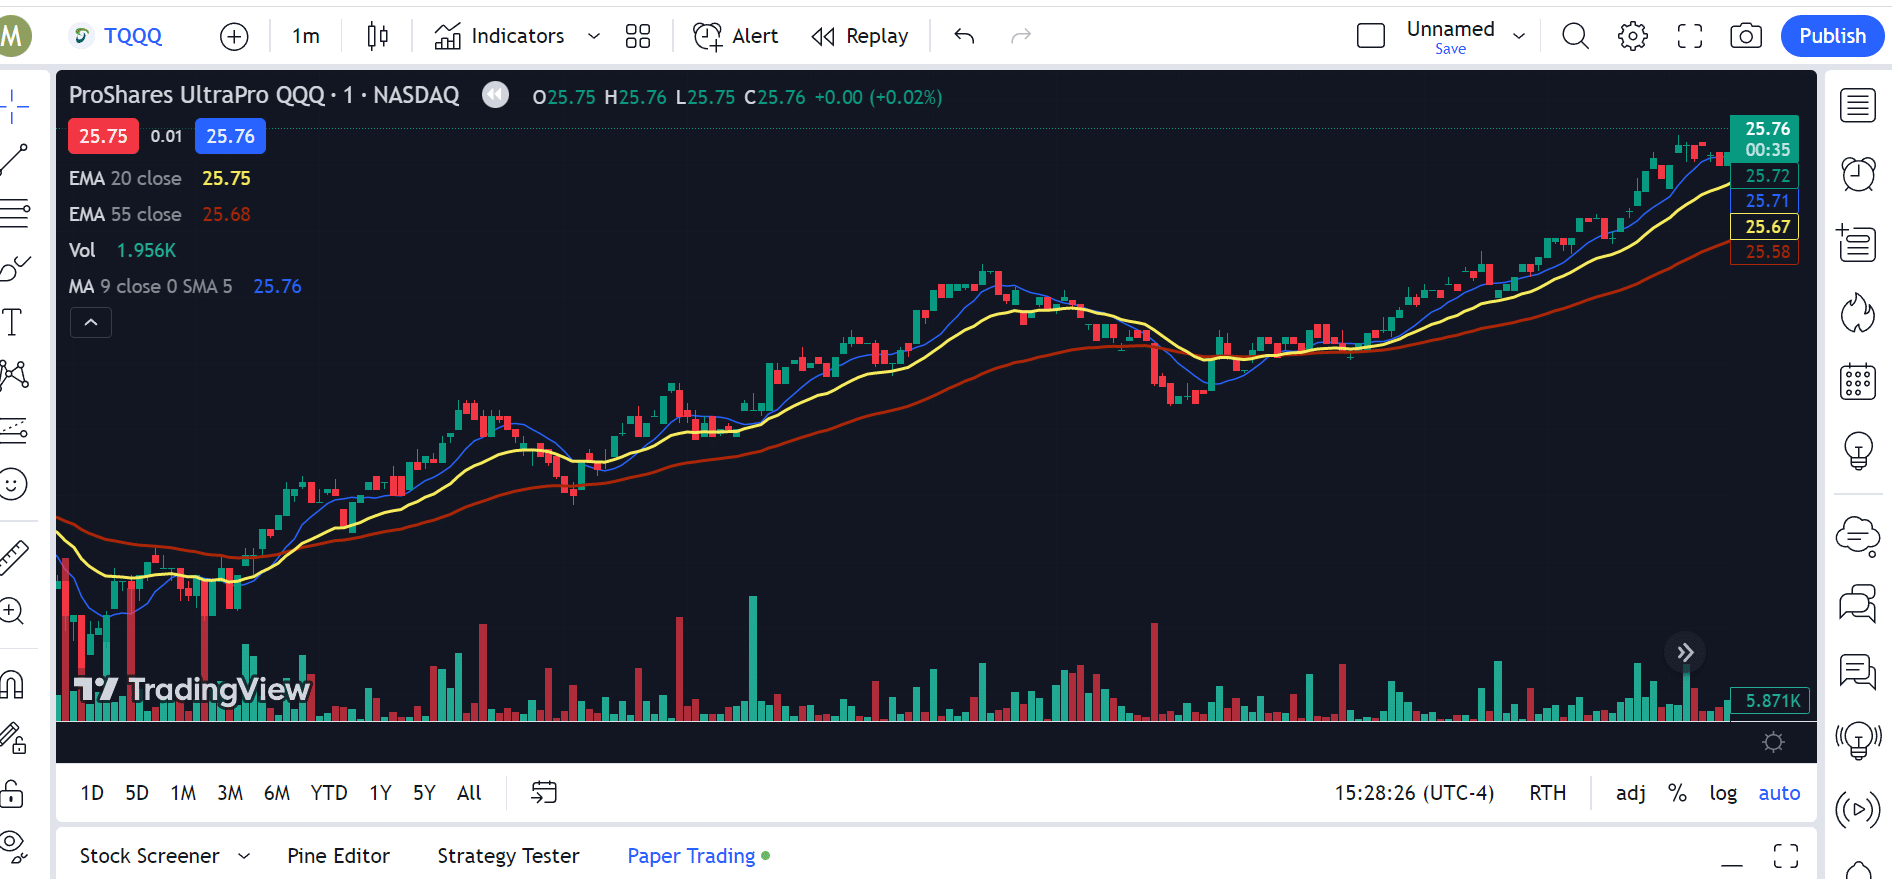
- Bar Replay. Rewind markets and watch with user-defined speed and resolution.
- Spreads. Create your own custom formulas using math.
- Custom time intervals.
User Experience:
TradingView is an extremely useful trading environment, with a robust list of tools for both fundamental and technical analysis. A great feature that can help traders react quickly when markets are moving are TradingView's trading charts.
Pricing:
Tradingview Pricing is one of the most competitive in the industry.
Like/Dislike About Tradingview:
Like:
- Here's what TradingView does really well: It's easy-to-use for new traders who are learning about different indicators, trading strategies, and developing their own unique style while being exceptionally powerful for traders with decades of experience and their own custom scripts.
- 12 chart types. Including Renko, Kagi and Point & Figure — all customizable.
- Up to 8 charts per tab. Plus, synchronize symbols, intervals and even drawings
- Custom time intervals
Dislike:
- The software only supports limited data sources, so traders may have to use other platforms to access more comprehensive market data.
- Trading View Chart Software is only available on desktop and web-based platforms. This may be inconvenient for traders who prefer to trade on the go.
Product Updates
- TradingView is the most active social network for traders and investors. Connect with millions of traders from around the world, learn from the experiences of other investors and discuss trading ideas. Advanced Charts TradingView has excellent charts that surpass even desktop trading platforms in quality.
Get started with Tradingview
2. Trendspider
Best For Ease-of-use and market analysis.
Our Take
The software allows traders to analyze market data in real-time, identify trends, and set up automated alerts for potential trading opportunities. It also provides a wide range of technical indicators and drawing tools to make it easier for traders to identify entry and exit points. In this article, we will look at the pros and cons of using TrendSpider Chart Software for trading stocks and options.
| Best For | Ease Of Use |
|---|---|
| Price | $39.00/mo-$179.00/mo |
| Annual Discount | Yes – Three months free |
| Promotion | Try Free |
TrendSpider Chart Software is designed to be user-friendly, making it easy for traders of all levels to use the software. It has a simple and intuitive interface that helps traders navigate the software quickly and easily.
The software allows traders to set up automated alerts for potential trading opportunities. This saves time and eliminates the need to constantly monitor the markets..
TrendSpider Chart Software offers a wide range of technical indicators and drawing tools, helping traders identify entry and exit points more accurately.
Cost-Effective: The software is highly cost-effective, making it accessible to traders of all budgets.
TrendSpider is best for multi-timeframe AI automated pattern recognition. Both platforms offer excellent charts, backtesting, and usability.
TrendSpider is the industry's easiest, fastest, simplest, and safest way to create, test, and refine trading strategies.
Key Features:
- Automate order execution with SignalStack: a tool that makes it easy to connect your strategy alerts to your brokerage account with not coding required.
- This saves time and eliminates the need to constantly monitor the markets.
- TrendSpider Chart Software offers a wide range of technical indicators and drawing tools, helping traders identify entry and exit points more accurately.
- Join the official TrendSpider Discord Server to connect with TrendSpider staff and other users directly.
- Quickly pop-up a live chart from TrendSpider anytime you come across a symbol on the web using the chrome extension.
User Experience:
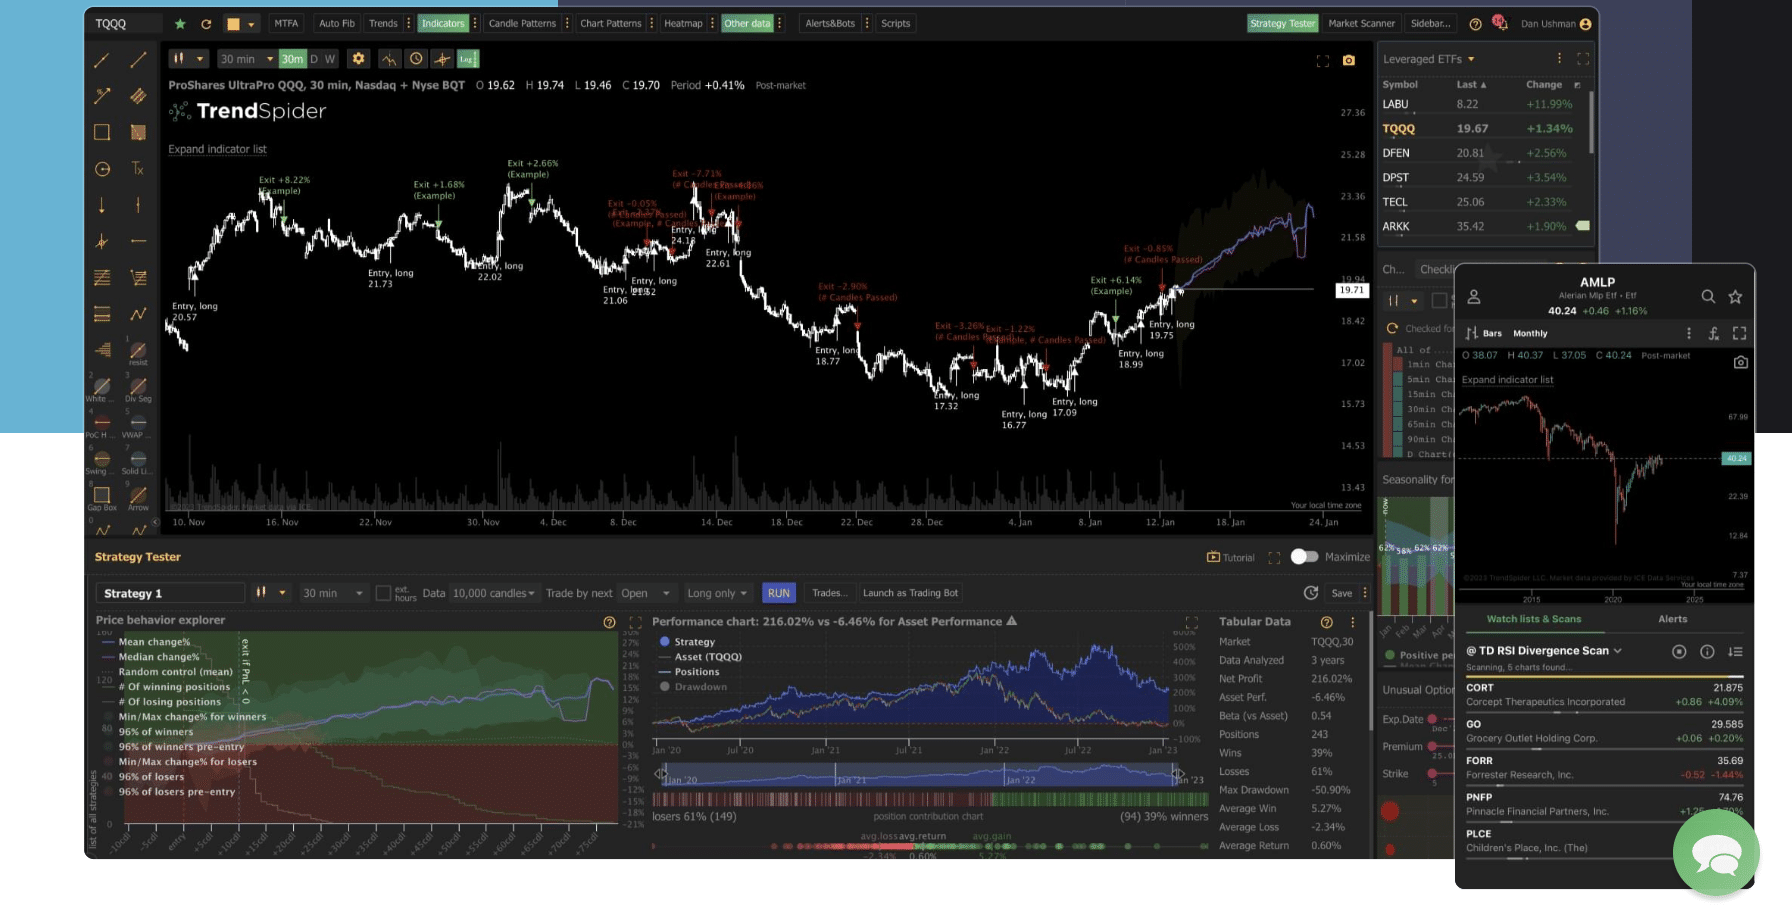
TrendSpider is best for multi-timeframe AI automated pattern recognition.
TrendSpider is an innovative program that's pushing the boundaries of what's possible with trading software."
With added extension of Signalstack this software is worth trying with their free trial.
Pricing:
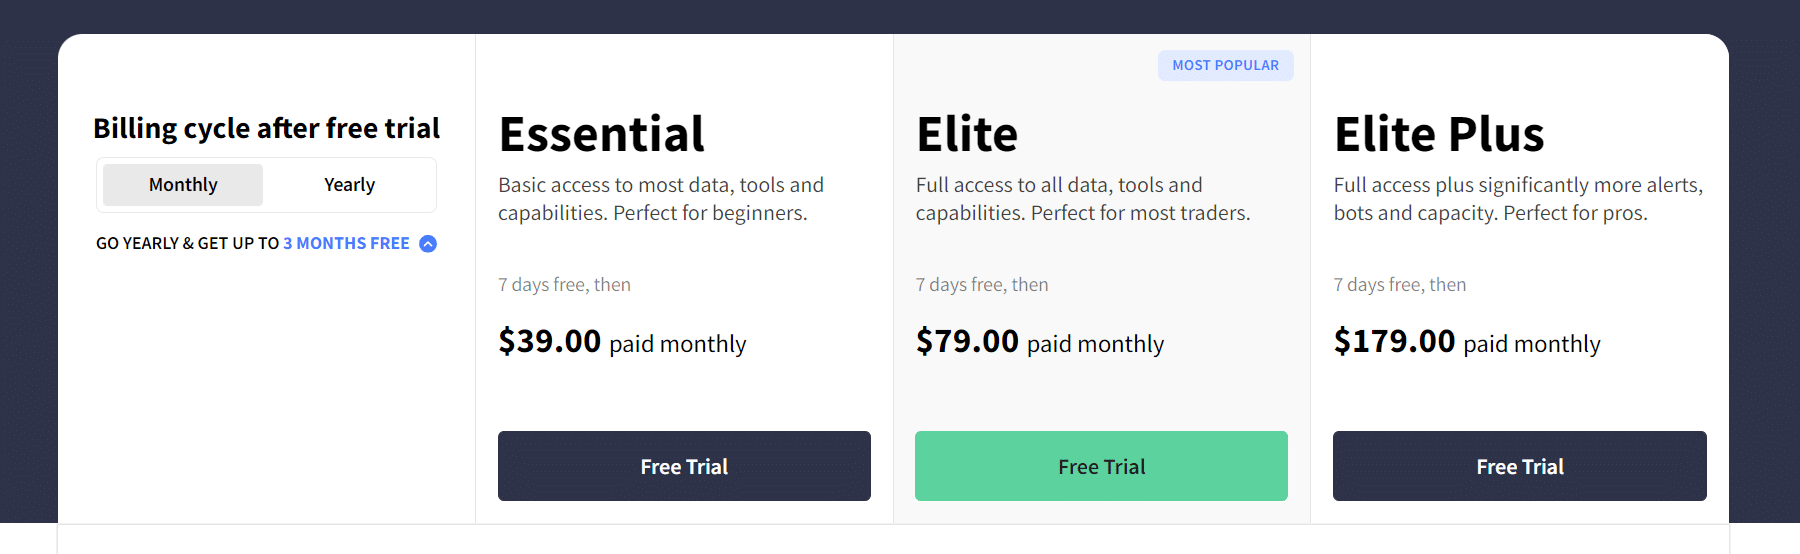
Trendspider prices are affordable for the beginner, but the software offers plans for the novice trader.
Like/Dislike About Trendspider
Like:
- Easy to use for all traders with a simple and intuitive interface.
- Automated alerts.
- Wide range of technical indicators.
Dislike:
- Limited Data: The software only offers data from the US markets. This means traders who want to trade in other markets will have to use other charting software.
- TrendSpider Chart Software is only available on the web and mobile devices. This means traders who prefer to use desktop-based charting software will have to look elsewhere.
Product Updates
- Overall, TrendSpider Chart Software is a great tool for traders of stocks and options. It is easy to use, offers a wide range of technical indicators and drawing tools, and is highly cost-effective. The added feature of Signalstack is a plus also.
Get started with Trendspider
3. Trade-Ideas
Best Charts With Alets Setup

Our Take
Trade-ideas is our third choice for the best chart software. Although their main focus is on alerts to specific changes and possible trades, their charts will enhance this aspect of software.
| Best For | Customization |
|---|---|
| Price | $118/mo-$228/mo |
| Annual Discount | yes - save 27% |
| Promotion | Different Times Of The Year |
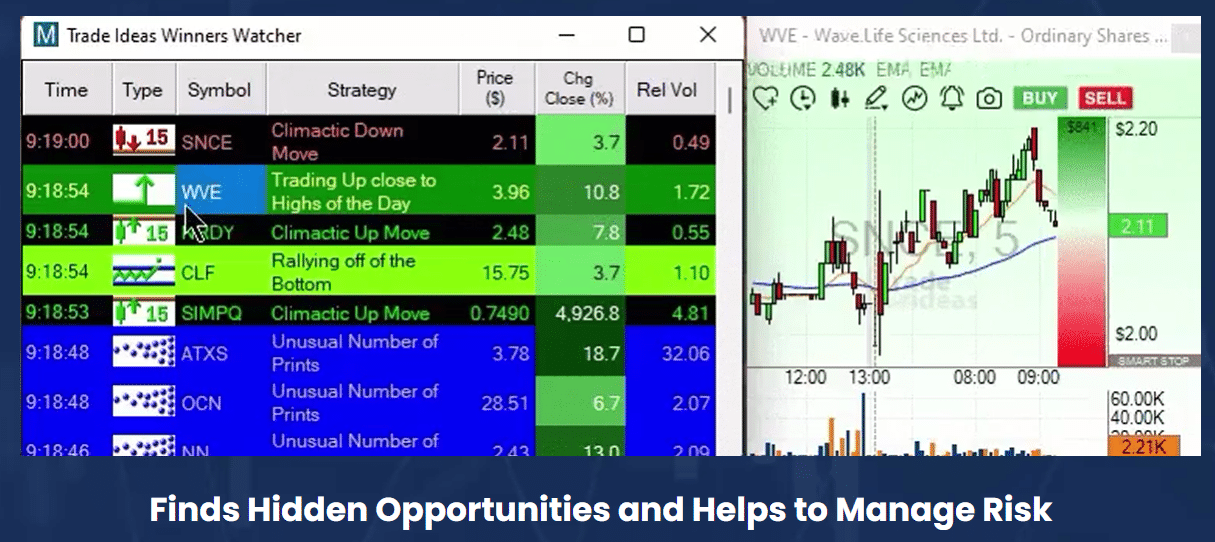
The main advantage of Trade-Ideas Charts is the variety of data they offer.
The charts can display a range of technical indicators, such as moving averages, support and resistance levels, and volume.
The charts also provide news related to specific stocks, which can be a valuable source of information when making investment decisions.
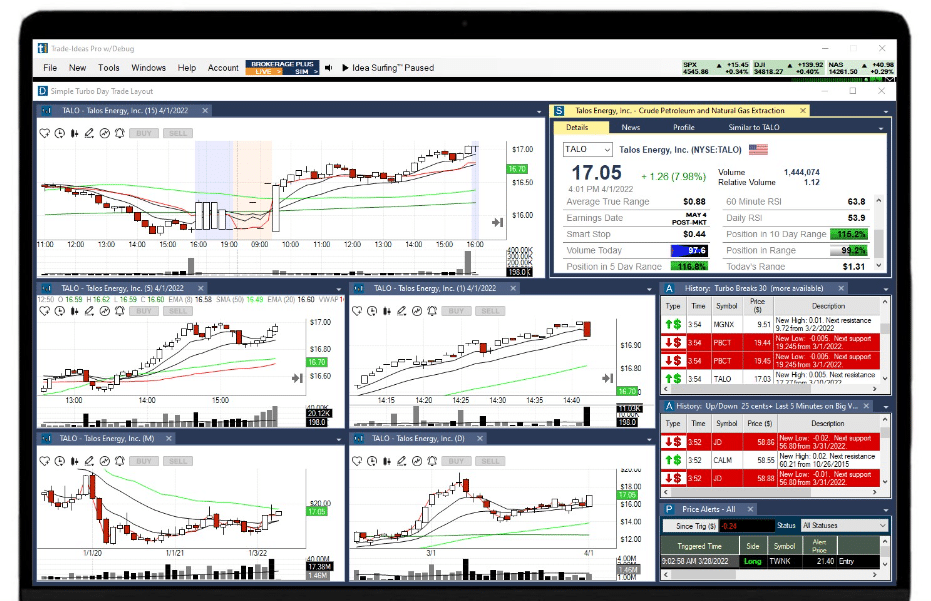
In addition to the data they offer, Trade-Ideas Charts are also easy to use. The charts feature intuitive design and layout, making it easy to quickly find the information you need.
They also offer a variety of customization options, allowing you to tailor the charts to your trading style
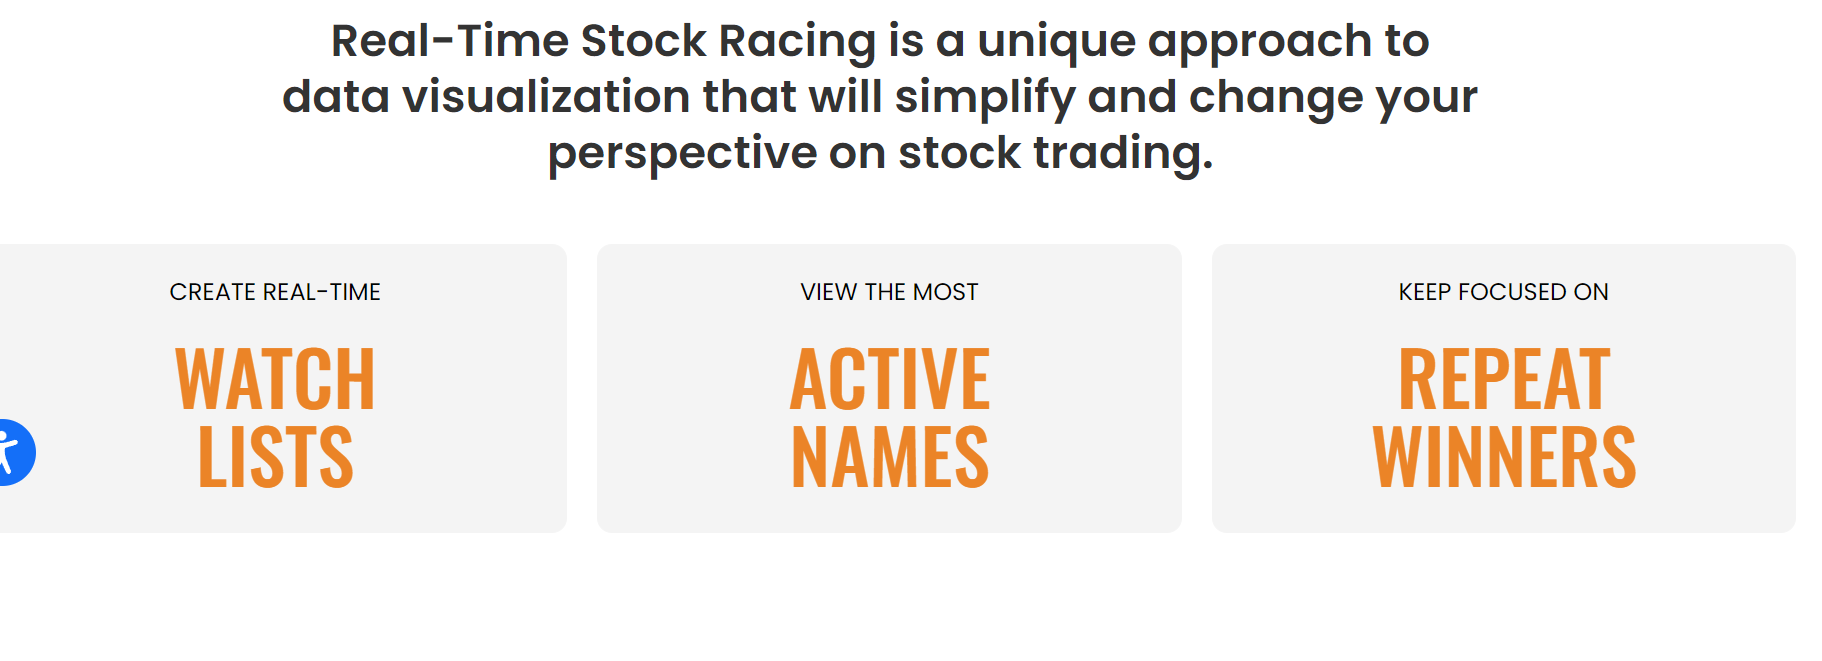
Stock Racing technology is a brand new visual perspective on scanning the market. Welcome to the future of stock scanning and Trade Ideas is the only company offering this exceptionally powerful tool.
Trade Ideas connects directly to your ETRADE account for $0 commission trading with our Brokerage Plus portfolio management module. Manage your $0 commission trades, ETRADE portfolio, even automate your trading strategies or use the AI.
Trade Ideas connects directly to your ETRADE account for $0 commission trading with our Brokerage Plus portfolio management module. Manage your $0 commission trades, ETRADE portfolio, even automate your trading strategies or use the AI..
Simulated Trading is now available with both Standard and Premium subscriptions. Gain confidence and learn how to take action in the markets.
Key Features:
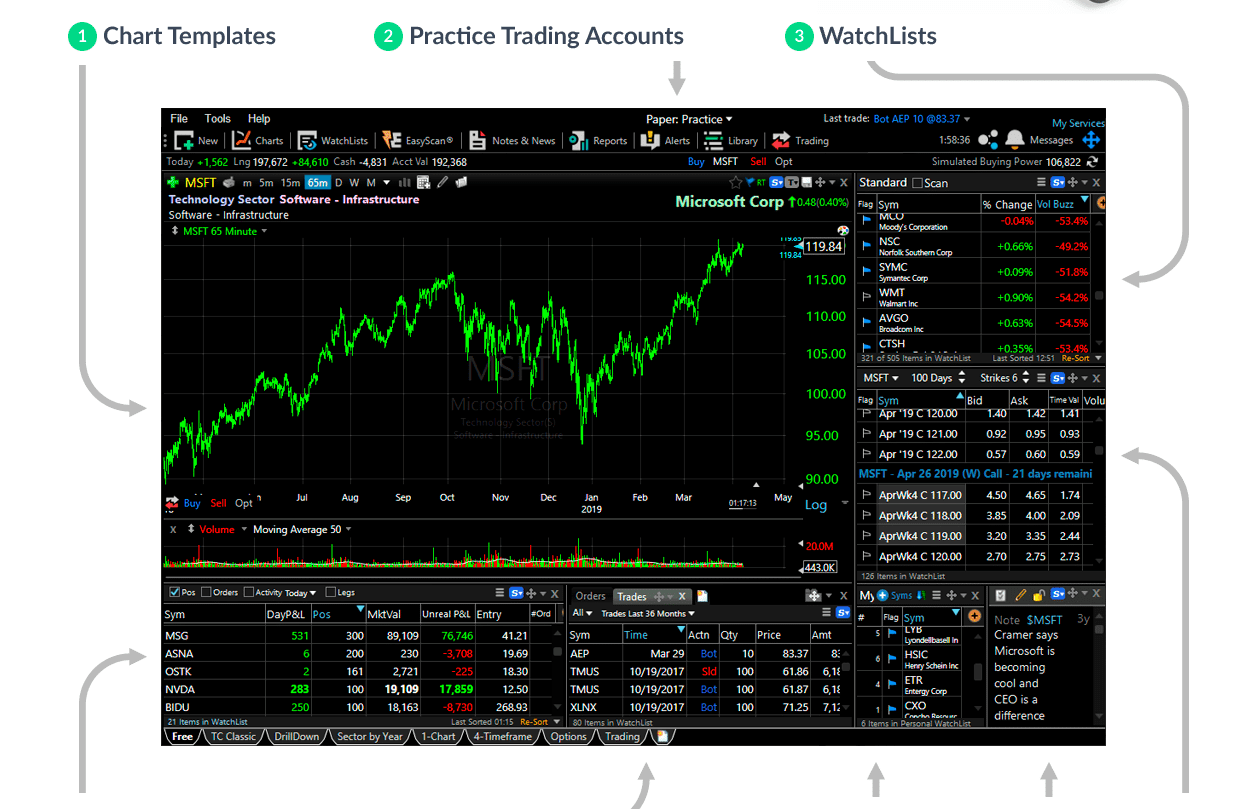
- If you’re just getting started with online trading, Trade Ideas provides the education, practice, and support you need to become a successful self-directed investor.
- All Trade Ideas subscriptions include unlimited access to the live Trading Room Community, educational courses, and real-time Simulated Trading.
- Even if you’ve been trading online for years, the tools and resources included in a Trade Ideas subscription enable you to improve your skills and have more confidence in your strategies.
- The ability to tweak and optimize using the event based backtester, the OddsMaker, and custom formulas mean there are no limits to the strategies you can employ.
- Investors who are confident in their risk tolerance discipline and strategy refinement can enter the world of trading automation with Trade Ideas.
- The Brokerage Plus module connects to participating brokers enabling traders to autotrade their own optimized strategies or the AI’s trades. From one-click trading to fully automatic
User Experience:
AI portfolio management, no other market intelligence platform delivers the flexibility and customization of Trade Ideas.
Established in 2003, Trade Ideas LLC caters to investors, traders, and market professionals in over 65 countries.
Pricing:
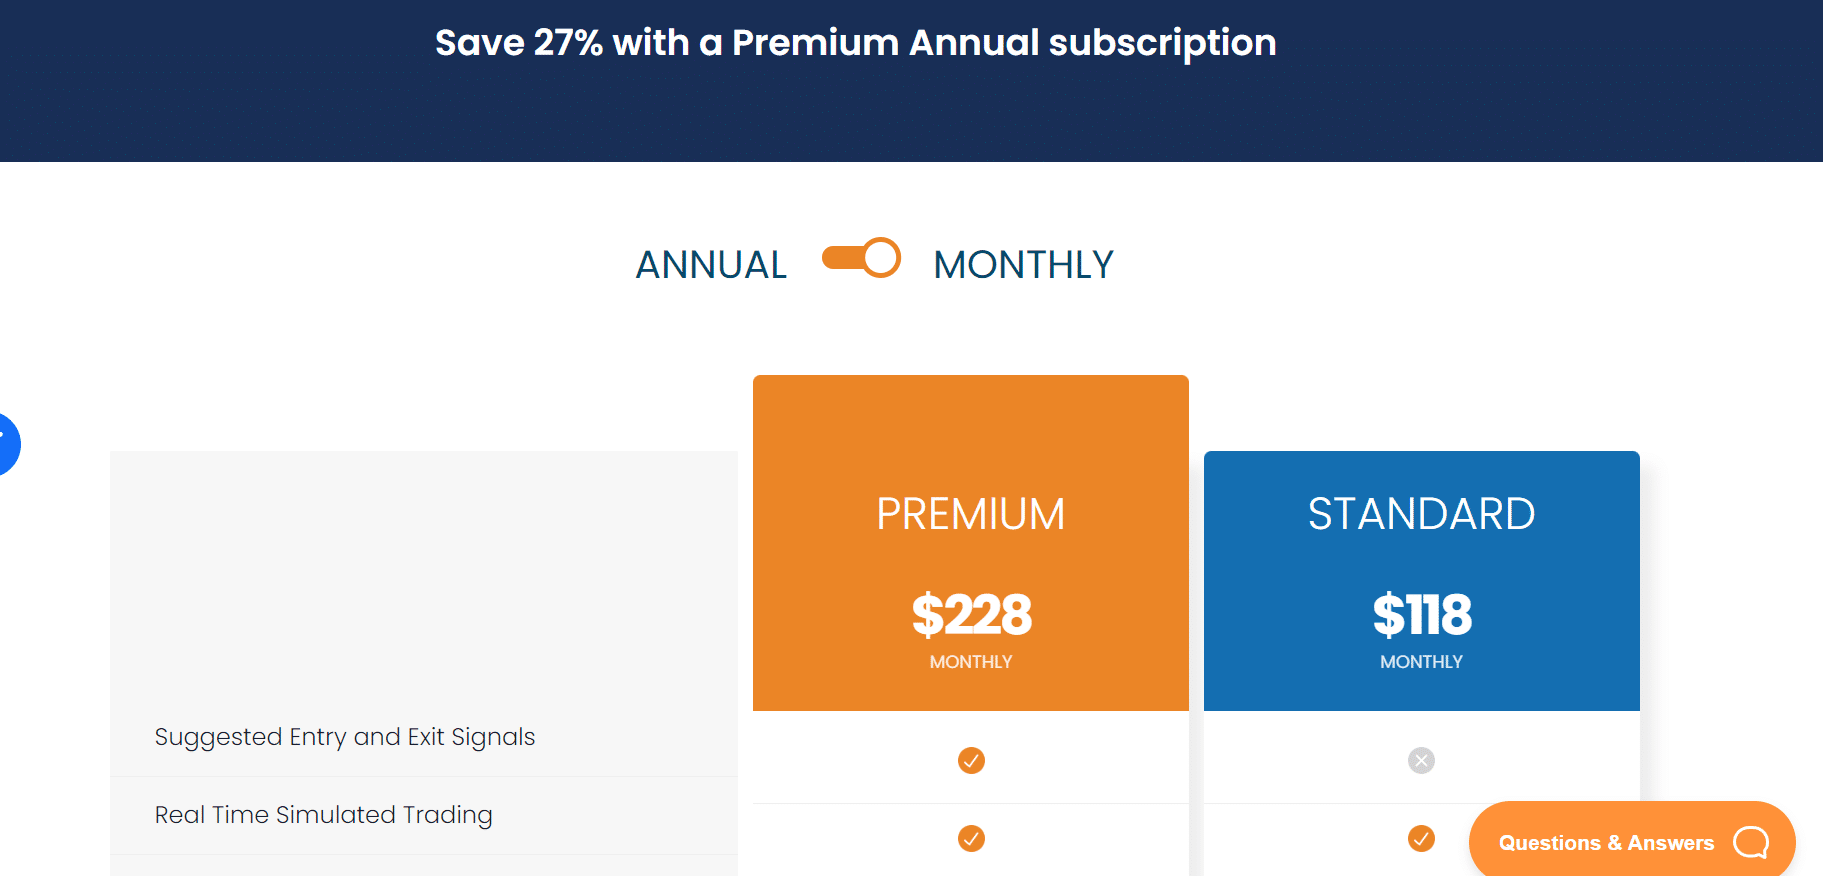
Starting from $118.00 per month, you’ll find all you’re looking for and more.
Like/Dislike About Trade-Ideas charts
Like:
- Charts are user friendly and easy to understand.
- Multiple charts can be displayed on one screen.
- AI integrated can offer advantages.
Dislike:
- One potential downside of using Trade-Ideas Charts is the cost.
- The charts are not free, and the cost can add up quickly if you are using them on a regular basis.
- In addition, the charts can be overwhelming for those who are new to technical analysis. The charts display a lot of data, which can be confusing and intimidating to novice traders. It may take some time to get familiar with the charts and to understand how to interpret the data they offer.
Product Updates
- Trade-Ideas will introduce Crypto trading.
- Overall, Trade-Ideas Charts can be a valuable tool for traders who are looking for an edge in the stock market.
Get started with Trade-Ideas Charts
4. TC2000
Best For Stability and ease-of-use.
Our Take
If you’re a fan of having a great-looking website, I suggest going for Squarespace. With beautiful sites made possible for both beginners and novices, Squarespace even provides in-built analytics to get information about your visitors.
| Best For | Best Designed Sites |
|---|---|
| Price | $14/mo-$49/mo |
| Annual Discount | Yes – Save $25% |
| Promotion | Get Started Free |
TC2000 charting software provides a variety of technical indicators and charting tools, which can be used to identify trends and perform technical analysis. This makes it easier for traders and investors to make informed decisions.
TC2000 charting software provides a comprehensive view of historical price data, including intraday, daily, weekly, and monthly charts. This makes it easier to identify long-term trends and improve the accuracy of predictions.
TC2000 charting software provides a wide range of customization options, allowing users to adjust the appearance of their charts to suit their individual preferences. This includes the ability to add custom indicators and overlays.
Easy-to-use Interface: The interface of TC2000 charting software is intuitive and user-friendly, making it easy to use, even for beginners.
Plot option charts with the underlying stock to see the relationship between the two. Now you can plot bid/ask data or last-trade data. This makes beautiful, streaming charts for even the most thinly traded options.
Track your positions, pending orders and trades. Whether you are in a real account or in the trading simulator, you get access to stock & option strategies. You can place limit orders, bracket orders with profit targets & stops, OCA's, multi-leg orders and more.
Create unlimited paper accounts to test your ideas and strategies. There's no better way to learn without risking a penny of real money.
Drag-and-drop symbols to your Favorites Watchlist. Manually rearrange to keep your most important items at the top. Have a plan, stay organized and follow it.
Key Features:
- Create unlimited paper accounts to test your ideas and strategies. There's no better way to learn without risking a penny of real money.
- Drag-and-drop symbols to your Favorites Watchlist. Manually rearrange to keep your most important items at the top. Have a plan, stay organized and follow it.
- Access dozens of market index watchlists including the SP-500, Nasdaq 100, High Cap 1000, NYSE, Biotechs, Gold & Silver, Airlines, Oil, Financials, TSX and more.
- When something catches your attention or you want to remember something specific about a stock, write a note to make sure it doesn't fall through the cracks. Journaling is a great way to improve your own personal trading habits. Charts are automatically saved with your notes for quick reference when reading in the future.
- Trade Multi-Leg Strategies from the Chart
User Experience:

The condition wizard is the heart & soul of TC2000. If you can think it, you can build a condition for any indicator step-by-step. Formula writing is not necessary, but certainly available. "Flex" conditions unfold over time making a whole new world of possibilities.
Historical and streaming bid/ask data means you always know what the market is doing, even when no contracts are trading. Plot intrinsic value, time value and more. Once you see these charts, you'll never go back to anything else.
In 1995, EasyScan® could scan a thousand stocks in 2-seconds. Imagine what it can do today. Testing millions of data points for your conditions on-the-fly … will spoil you
Pricing:
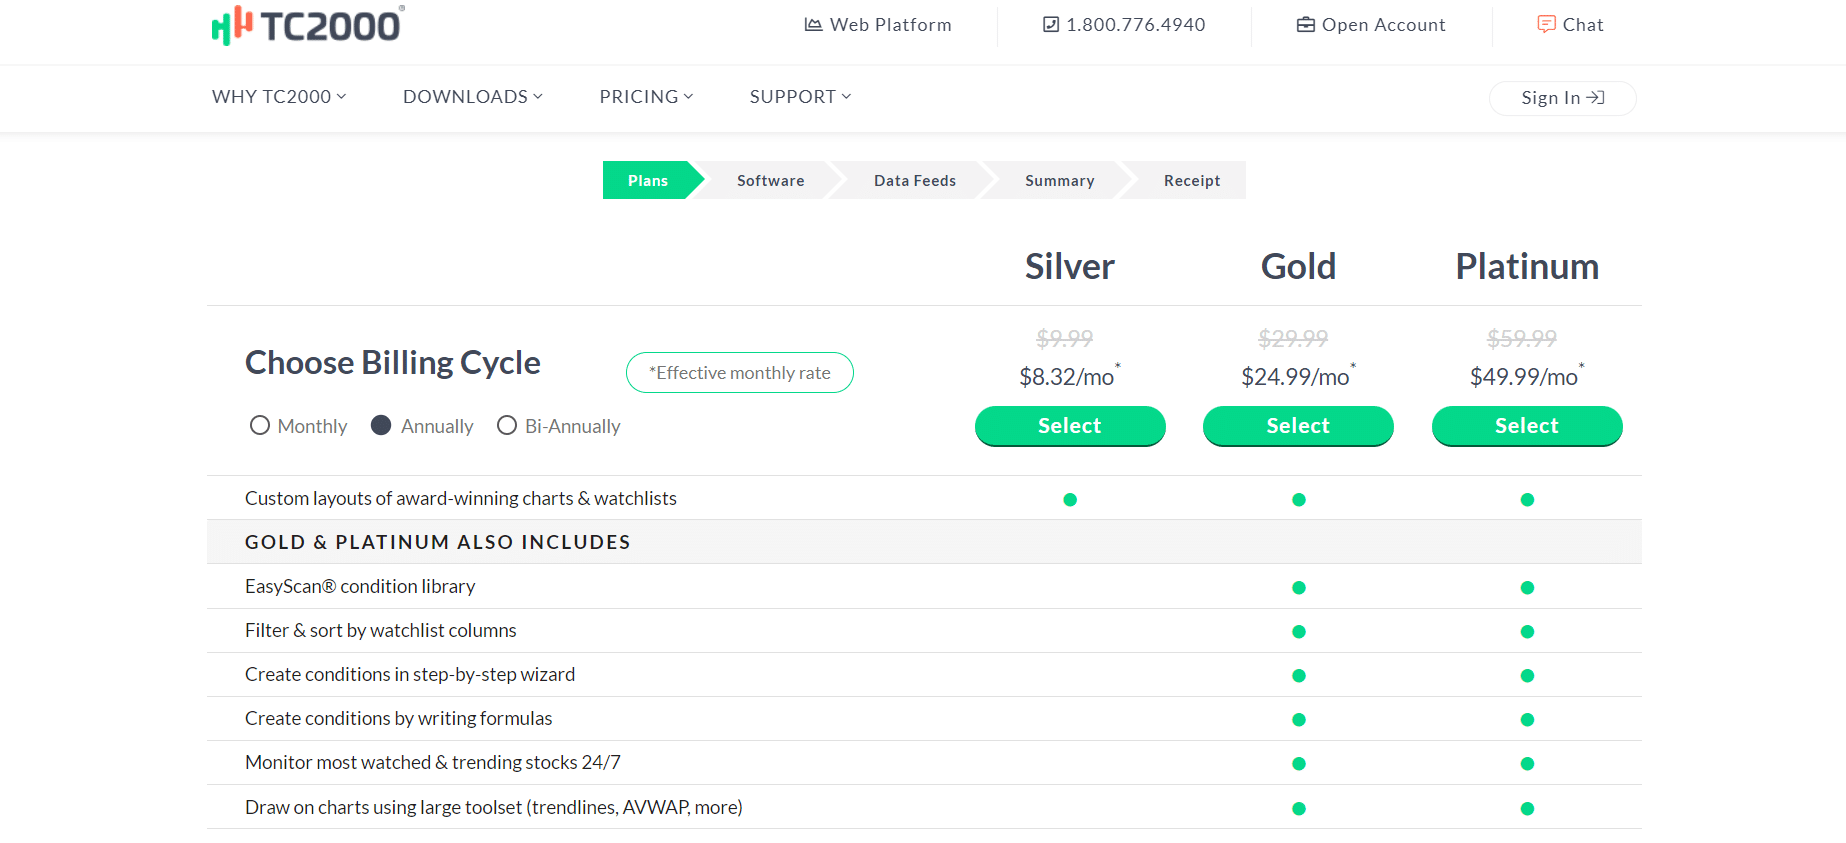
Monthly prices range from $8.32 for their “Silver plan” to $49.99 per month for their Platinum plan. (Advanced) Plan. Additional charges are not included for the real time data feeds for stocks and options.
Like/Dislike About TC2000
Like:
- Limitless amount of indicators that can be plotted on the charts.
- Access chart library from prebuilt to your own.
- You can create a high number of charts on many screens to fit your needs.
Dislike:
- Cost: TC2000 charting software is not free, and can be quite expensive for some users.
- TC2000 charting software is only available on Windows and Mac computers, and is not compatible with mobile devices.
Product Updates
- TC2000 charting software is only available on Windows and Mac computers, and is not compatible with mobile devices.
- Version 23 was released and a number of improvements were made.
Get started with TC2000 Charts
5. Finviz.
Best For Stock Market Overview
Our Take
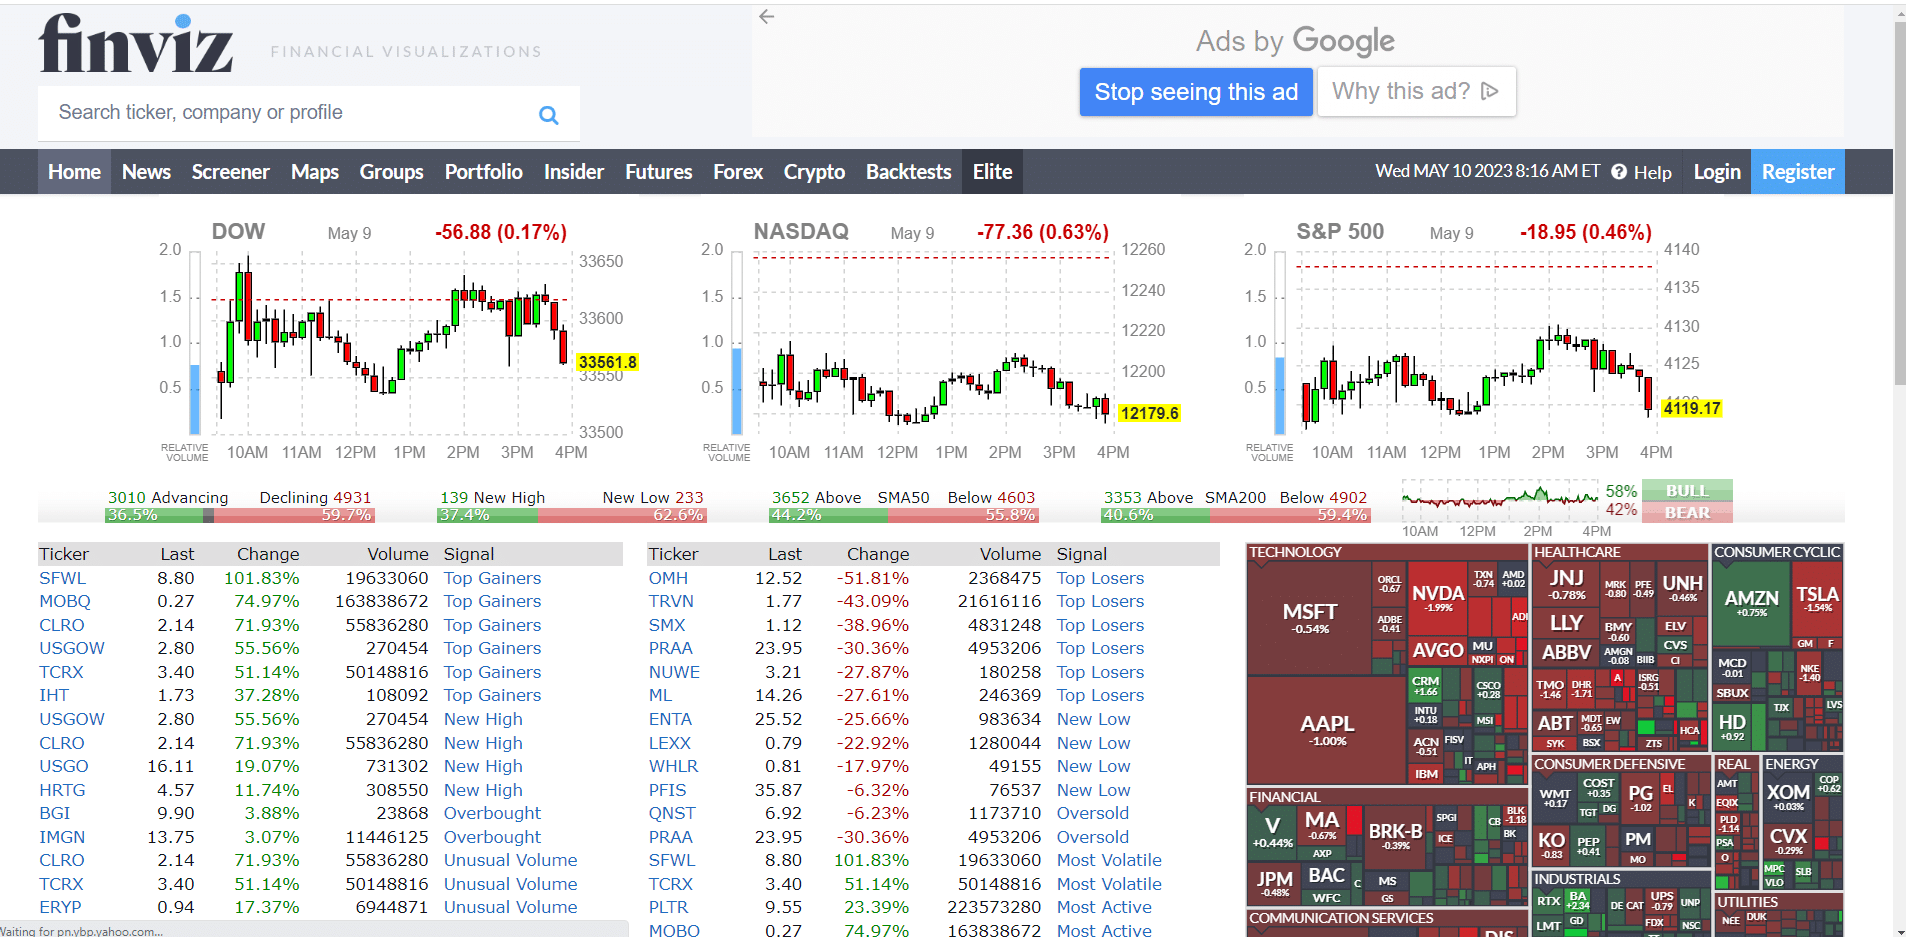
Finviz offers an array of charts, graphs and data points that can be used to analyze stocks, commodities, and indices. It also offers an extensive collection of news and research articles that can be used to gain insight into the markets.
| Best For | Stock and market screener |
|---|---|
| Price | Bird's eye view of market and stocks |
| Annual Discount | Yes – Save 5% |
| Promotion | Get Started Free |
Finviz offers an array of charts, graphs and data points that can be used to analyze stocks, commodities, and indices. It also offers an extensive collection of news and research articles that can be used to gain insight into the markets.
Finviz offers a comprehensive set of features for investors of all levels. It has an easy to use interface and a wide range of data points and analysis tools that can be used to analyze stocks, commodities, and indices.
Finviz also offers a variety of charts and graphs that can be used to visualize and compare financial information. Additionally, the website offers a robust news feed with articles from a variety of sources that can be used to stay up to date on the markets.
Key Features:
- Finviz can be easily used by both casual and professional investors wanting specific data about the US stock market.
- The Finviz screener offers three different types of filters: Descriptive, Fundamental, and Technical.
- The Descriptive filters are the most basic set of filters available on exchanges, including market capitalization, dividend yield, earnings date, average volume, industry, price, nation, and so on. These are the initial filters you'll use to narrow down your search.
- Fundamentals are the second set of filters, and they provide even more specific information about the stocks. The user can filter tickers based on a variety of criteria, including margins, quarterly sales growth, EPS growth, insider ownership, and the basic P/E ratio. Data on P/E ratios are crucial since they reveal how a firm is predicted to perform in the future.
- The technical filters, which include moving averages, gaps, RSI, volatility, performance, percentage change, after-hours movement, and others, are the third filter choice. Candlesticks and designs are also included on this page.
User Experience:
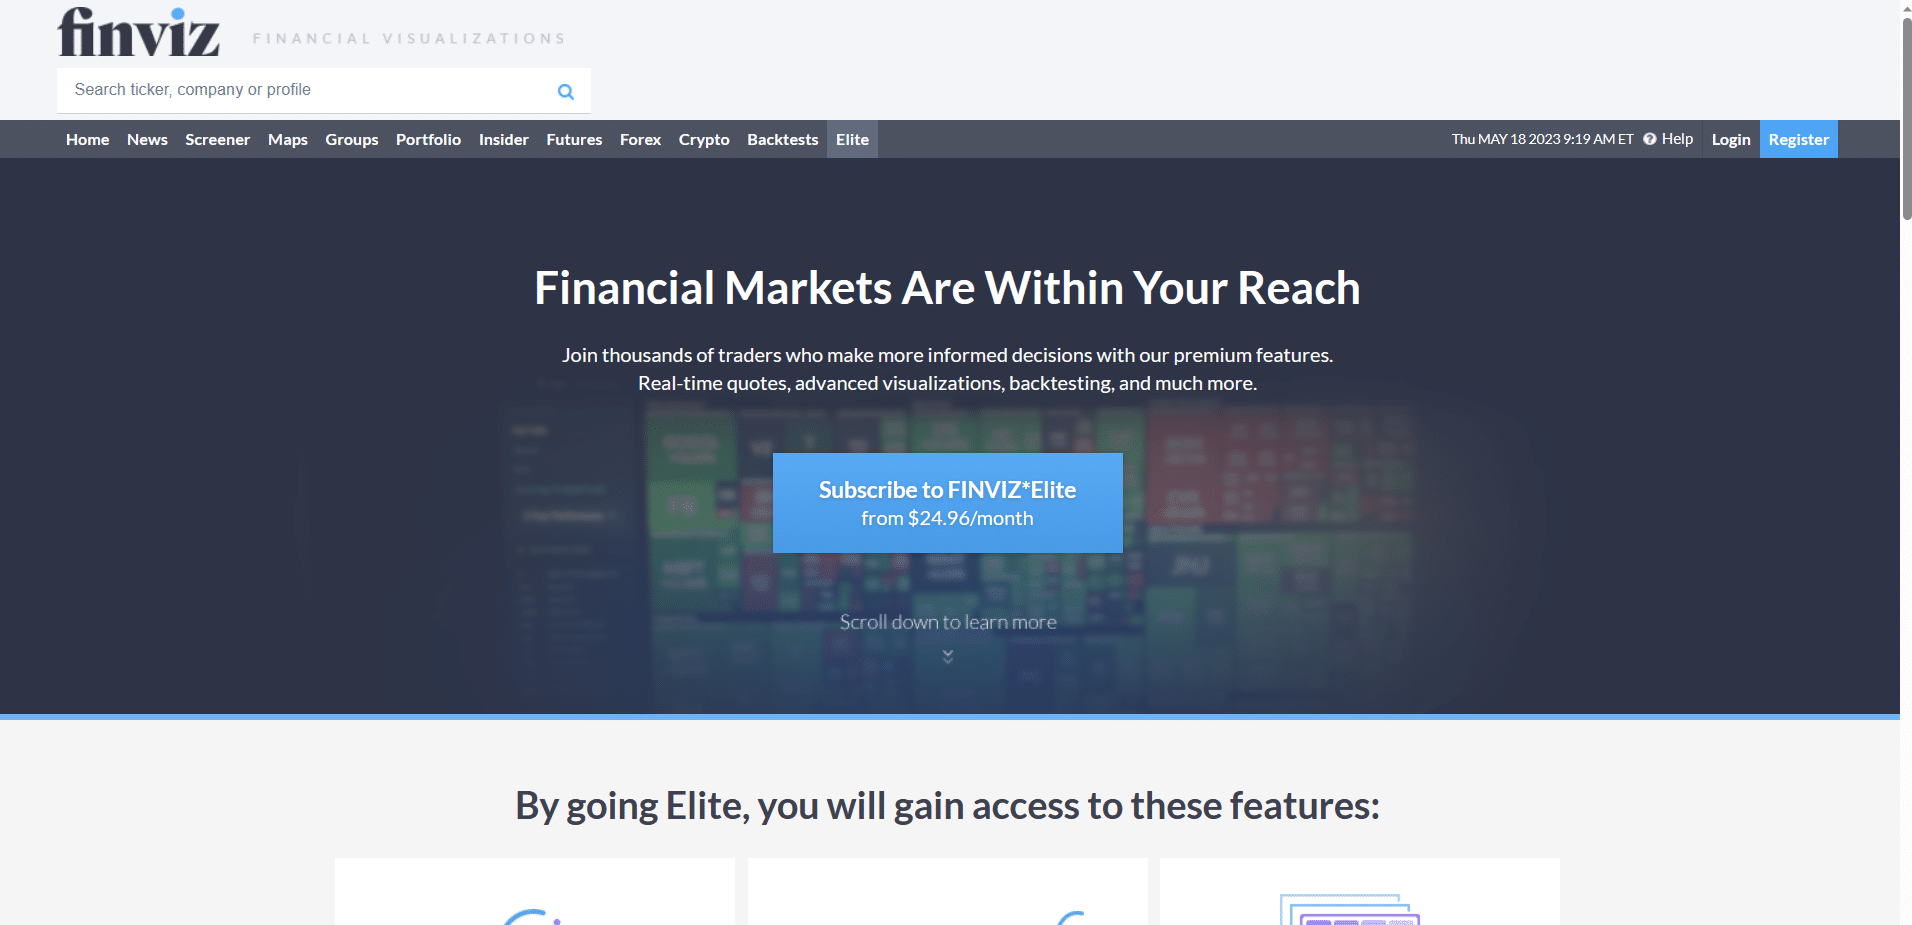
The basic version of the website is free, but it does not offer the same level of functionality as the premium version. The premium version of Finviz is quite expensive, with plans starting at $25 per month.
Additionally, some of the features offered on the free version are limited or not available on the premium version.
Overall, Finviz is a powerful financial visualization website that offers a wide range of features for investors of all levels. The free version of the website is a great starting point for beginners, while the premium version offers more advanced features for more experienced investors. Weather you day trade or long term trade it is an essential tool for capturing all relevant information for the market itself and also for individual stocks.
Pricing:
Finviz has only one price of $25 per month. You can simply create an account and use the free features and the subscription would give you access to many useful features.
With an average page visit of 1.2 million a month, information that is available is widely used for reference of trading and the status of the markets in general
Use the secret weapon of the most successful traders: knowledge, and Finviz is a great straight to the point information gathering.
Finviz also provides users with graphs and charts to help them better understand their results. For example, the screener can provide a chart of a particular stock’s performance over a certain period of time. This helps investors identify trends and decide if a particular stock is a good investment.
In addition to the stock screener, Finviz also provides a news feed. This feed includes information on the latest developments in the markets, as well as any new stock offerings. This is a great way for investors to stay on top of the latest news and make informed decisions.
Like/Dislike About Finviz:
Like:
- Overall, Finviz stock screener is a great tool for investors.
- It provides a comprehensive set of criteria to help investors narrow down their search and visualize their data.
- The screener also helps investors stay informed with its news feed. Finviz is an invaluable resource for investors looking to add stocks to their portfolios.
Dislike:
- Delayed data for the free version.
- No mobile app available.
- Limited number of filters compared to the other stock screeners.
- Very basic charts in free plan.
Product Updates
- Stock screening, news, financial statements, insider trading, analyst recommendations, portfolio tracking, industry heatmaps, and interactive charts, provide you with all the tools you need to find, track, and research stocks.
- Elite users can also backtest trading strategies using over 100 different technical chart patterns.
Get started with Finviz